
What is modeling in GA4?
- February 14, 2024 Sivanaadh Baazi
In the context of GA4, Modeling refers to the process of using different algorithms and statistical techniques to predict and fill in gaps in data where direct measurement is not possible.
Due to privacy regulations, cookie restrictions, and users opting out of tracking. This leads to incomplete data about user behaviour on website or mobile app.
Modeling will help to predict the user interactions when it can’t be directly observed. It will give complete picture of users who landed on website or app.
The main goal of modeling in GA4:
Filling Data Gaps: To provide estimates for missing data due to tracking limitations, ensuring that reports are more complete and represent user behavior more accurately.
Enhancing Privacy: By relying on modeling rather than solely on direct tracking, GA4 can help maintain user privacy while still offering insights into user behavior.
Cross-Device and Cross-Platform Measurement: Modeling allows GA4 to better understand how users interact with content across different devices and platforms, even when direct tracking is not possible.
Conversion Modeling: GA4 uses modeling to estimate conversions that might not be directly observable due to users blocking analytics or navigating across devices.
GA4 uses various machine learning algo’s and it will continuously learns and updates its models to reflect user behavior patterns and tracking landscape
How GA4 Modeling Works?
Google Analytics 4 (GA4) uses a modeling to estimate user behavior when direct data collection is not possible due to users declining analytics identifiers like cookies(consent mode). At the time of universal analytics its not possible to track users data who ever declined cookies. In GA4 this modeling helps in maintaining data accuracy and completeness, even when direct measurement is not feasible. Here’s a simplified example to illustrate how modeling works in this context:
Scenario Without Modeling:
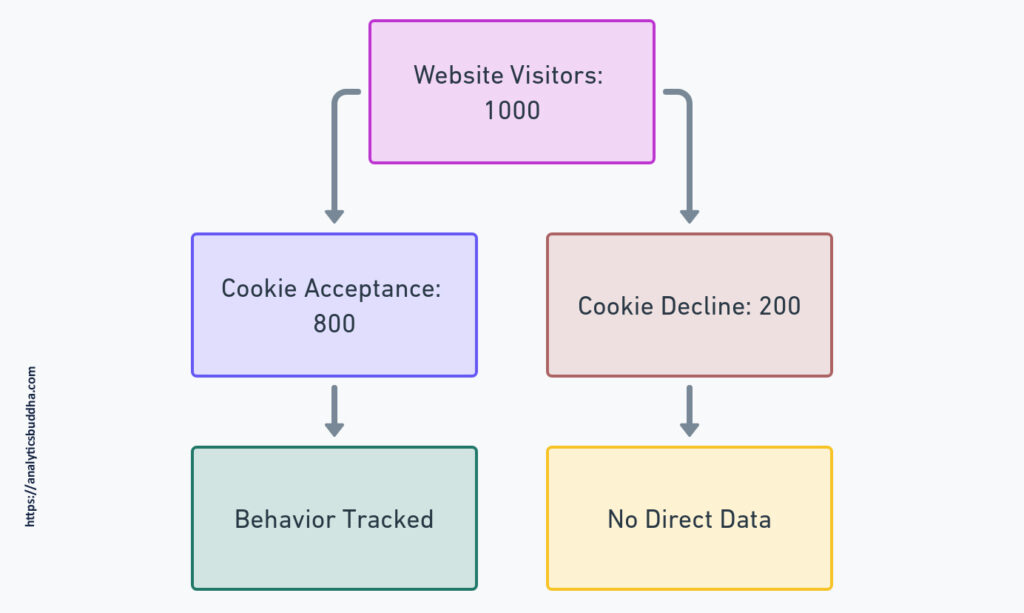
For example we have 1000 visitors came to website. In that 800 users accepted consent mode for allowing cookies i.e they have given a permission to track their behaviour (e.g., page views, conversions).
And remaing 200 users are declined content mode i.e not accepted cookies to track their behaviour.
In detailed:
- Website Visitors: 1000 visitors come to a website.
- Cookie Acceptance: 800 visitors accept cookies, allowing their behavior
- Cookie Decline: 200 visitors decline cookies, resulting in no direct data about their actions on the site.
So now the question is, Is it possible to track the behaviour of those 200 users?
Straight forward Answer is Noooooooo. Without modeling, the website owner only has detailed data of 800 visitors. The behavior of the 200 who declined cookies is a blind spot, It leads to incomplete insights and analytics.
Scenario With GA4 Modeling:
Now consider same example which we discussed in above scenario, 800 users who accepted consent mode (i.e. accepted cookies to track their behavior) & 200 users are not accepted. Now we check how GA4 modeling will help to get the details of These 200 Users.
As we already know we are in the world of “Artificial Intelligence”. Now you will read common sentence i.e. GA4 uses Machine Learning to understand the behaviour of Non consent users. It’s a 2 step process
Modeling Process: GA4 uses machine learning algorithms to analyze the behavior of the 800 users who accepted the consent mode. It identifies patterns and correlations in how different types of users interact with the site. For example
For example, 50 users who accepted the consent mode came from a social media platform. On average, they view 5 pages per session and have a 10% conversion rate.
GA4 Will record the following metrics of these users behaviour like
- Pages they visit
- Average time they spend
- Referral site’s from which they came
- Device type
- Browser type
- Other available Signals
Behavior Estimation: GA4 now applies these learnings and patterns of the consent mode. Based on that, it checks for similarities among consenting users regarding the pages they visit, device type, source of visit, and other available signal data with 200 non-consent users who haven’t accepted consent mode.
This means that some of the non-consenting users also landed on the website from social media sites. Then, GA4 estimates these users’ behavior. Even without consent, GA4 collects minimal information like timestamps and event types (e.g., pageview) but without user identifiers. Based on these pings, it will use modeling to estimate user behavior.
GA4 estimates that these users would exhibit similar behavior (viewing an average of 5 pages per session and having a similar conversion rate), despite not having direct tracking data from these users.
Final Word about Modeling
After Modeling in analytics we can get insights and the behavior of all 1000 visitors, offering a more complete and accurate picture of overall site performance and user behavior.
GA4 offers different type of modeling’s
Each model used for different purposes and provides different unique insights. Based on the needs to we need to use these modeling techniques. The accuracy of modeling is depends on the quality of Data.
1. Behavioral Modeling
Estimates the behaviour of the non consent users by respecting the privacy of the users.
2. Conversion Modeling
In this modeling technique, it estimates missing conversions, I mean when This provides a more complete picture of your marketing impact event though conversions that can’t be directly attributed due to various reasons like privacy settings, technical limitations, or cross-device tracking
3. Attribution Modeling
Determines how credit for conversions is distributed across different touchpoints in the user journey (e.g., email, social media, website visit). This helps you understand which channels are most effective in driving.
| Feature | Conversion Modeling | Attribution Modeling |
|---|---|---|
| Goal | Estimate missing data | Distribute credit for conversions |
| Focus | Unattributed conversions | All conversions |
| Output | Increased understanding of overall marketing impact | Insights into which channels drive conversions |
4. Predictive Metrics
Predictive metrics in GA4 use smart programs to guess what users might do next, like whether they might stop using your app or website (churn) or if they might buy something. These predictions help you find users who might leave or buy, so you can adjust your marketing to keep them interested or encourage them to make a purchase. It’s like having a crystal ball for your business, helping you make smarter decisions about how to reach and keep your customers.
In this article we will focus on Behavioral Model in GA4
As I said so many times in this article, when consent mode is enabled and some of the users opted out consent mode, estimation of these users behavior is not possible with out modeling.
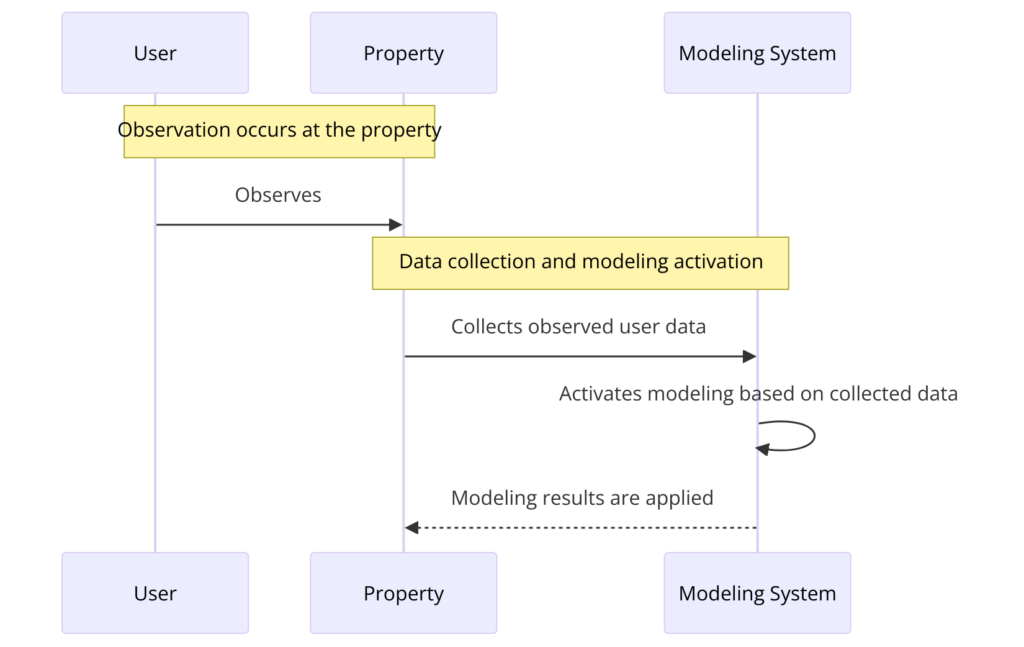
In behavioral modeling non consent users behavior is estimated based on the Observation of who allowed consent mode user activities and Based on these observations GA4 applies machine learning ( similar kind of consent users data) to estimate the insights about non consent users.
- Consent mode is activated across all pages or app screens.
- Tags load before the consent dialog appears on web pages.
- Google tags load regardless of user consent (advanced implementation).At least 1,000 events per day with denied consent are collected for 7 consecutive days with analytics_storage=’denied’
- At least 1,000 daily users send events with granted consent for 7 out of the previous 28 days with analytics_storage=’granted’
- Training the model may require more than 7 days of meeting the data threshold within 28 days, and additional data might still not be enough for successful training. Means Model training may require more than 7days first it collects the data of 7 days and for learning different patterns and analyzing data it may take another 7days to learn more data points in various contexts.
To view modeled data in your reports, follow these steps:
To view modeled data in your reports, follow these steps:
- Go to Admin and click on Data Display.
- Select “Blended” under Reporting Identity.
- Save your changes.
To hide modeled data, select a different option. Your choice won’t affect data collection or processing, and you can switch between options anytime without permanent impact. (You can switch anytime data won’t be lost)
Google Analytics combines modeled data with observed data in your reports. This integration may result in differences compared to reports containing only observed data, such as higher user counts. You can identify when modeled data is included in reports by the data-quality icon (Check below Screenshot).

Based on the Data Icon we can know that what type of data is it showing. For more details about data icon please refer GA4 official document about data icon.
These features don’t work with modeled behavioral data:
- Audiences: This refers to the creation of specific groups of users based on their behavior or attributes. Modeled data cannot be used to define these groups.
- User Explorer, Cohort, and User Lifetime Explorations: These features involve in-depth analysis of individual user behavior over time. Modeled data may not accurately represent individual user actions and therefore cannot be used in these analyses.
- Segments with a Sequence: Segments that are defined by a sequence of user actions or events cannot utilize modeled data since the sequence may not accurately reflect real user behavior.
- Retention Reports: Retention reports track how often users return to your site or app over time. Modeled data may not accurately represent user retention behavior.
- Predictive Metrics: These metrics forecast future behavior based on historical data. Modeled data may not provide reliable predictions for these metrics.
- Data Export (e.g., BigQuery Export): Modeled data cannot be exported to external platforms or databases for further analysis or integration.
What are the outcomes with Behavior data modeling
- Daily Active Users: How many people use your site or app each day.
- New Users from Last Campaign: The number of people who visited because of your latest marketing effort.
- User Journey to Purchase: The steps users take from arriving at your site to buying something.
- Geographic Visitor Distribution: How many visitors are from Germany versus the UK.
- Mobile vs. Web User Behavior: How users on mobile devices differ from those on web browsers.
Warning: foreach() argument must be of type array|object, false given in /home/u273767890/domains/analyticsbuddha.com/public_html/wp-content/themes/htmltheme/single-template.php on line 51

- February 14, 2024